Why Pharmaceutical Dissolution Stability Testing Fails: Lessons from Three SAHPRA Recalls

Three products.
Three SAHPRA-approved recalls.
Three dissolution failures that only appeared months after the batches had been released and distributed.

Lasix 80mg failed dissolution at six months. Lumont 10mg failed at twelve months. Cipla-Pioglitazone failed during ongoing stability monitoring. In every case the product passed initial release testing. In every case patients had already received it.

This is the central challenge of pharmaceutical dissolution stability testing: the conditions that cause a product to fail are often invisible at release and only become measurable after months of storage. When the dissolution testing method itself introduces uncontrolled variables, through manual sampling, inconsistent vessel setup or inadequate hydrodynamic control, failures become harder to detect and impossible to defend.

Why do products pass release testing and fail dissolution at stability?

The apparatus controls the dissolution conditions. It does not control what happens to the drug product during storage. That distinction is where most stability failures originate.

Three different storage mechanisms triggered three different failure modes in these recalls. Understanding each one is the starting point for building a dissolution programme sensitive enough to catch them before they become a market withdrawal.

What caused three SAHPRA dissolution stability failures?

Lasix 80mg: furosemide surface passivation

Sanofi Aventis South Africa recalled batch CG022A after dissolution dropped below 80% at 60 minutes at the six-month stability interval. Furosemide is a BCS Class IV drug with dissolution critically dependent on available surface area. During ambient storage, the tablet surface undergoes recrystallisation, converting to a more thermodynamically stable crystalline form that increases hydrophobicity, raises liquid contact angle and progressively retards media penetration. Invisible at release. Measurable at six months.

Lumont 10mg: montelukast excipient matrix hardening

Zydus Healthcare SA recalled Lumont 10mg after out-of-specification dissolution results at the 12-month time point under 30°C and 75% RH long-term conditions. The polymer excipient matrix undergoes cross-linking during extended storage at elevated temperature and humidity. Cross-linking increases structural rigidity, reduces water diffusion rates into the tablet core and creates a denser outer boundary that restricts media penetration. Drug release slows progressively and at month twelve it had slowed below specification.

Cipla-Pioglitazone: particle agglomeration and hydrodynamic dead zones

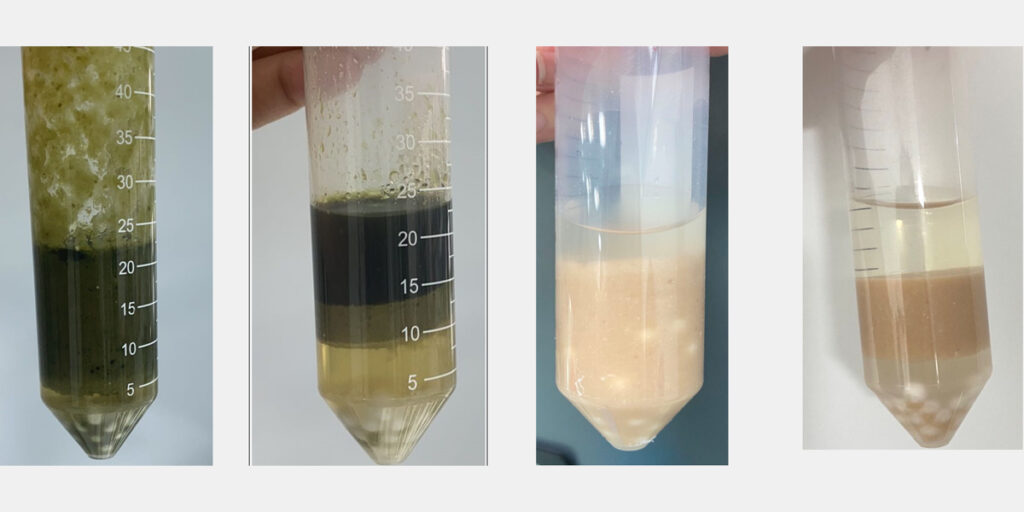
Pioglitazone is a BCS Class II drug with dissolution dependent on particle size and vessel hydrodynamics. During storage, particles agglomerate, clustering into larger masses that reduce total surface area. In a USP Apparatus 2 vessel those agglomerated masses settle into the near-zero velocity zone beneath the paddle shaft where fluid shear is insufficient to break them apart. Drug release drops. The result is a cone of undissolved material at the vessel base and an out-of-specification stability profile.

 

Why uncontrolled testing variables amplify stability failures

What connects all three recalls is not just the storage mechanism. It is the sensitivity of the dissolution method to detect the developing failure at the earliest possible time point.

Manual sampling introduces timing offsets between vessels. Variable cannula depth changes the concentration gradient at withdrawal. Inconsistent filtration alters the apparent dissolved fraction. Vessel misalignment and imprecise paddle height affect the hydrodynamic pattern within the vessel, including the stagnant zone directly implicated in the pioglitazone failure.

In a formulation where dissolution is already marginal, an uncontrolled testing variable is the difference between catching a failure at six months and missing it entirely until the batch has been on the market for a year.


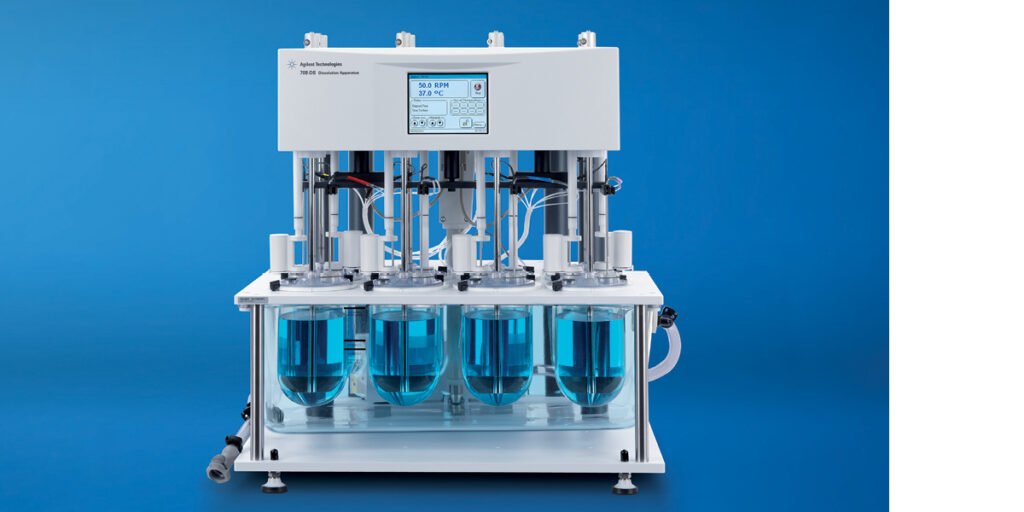
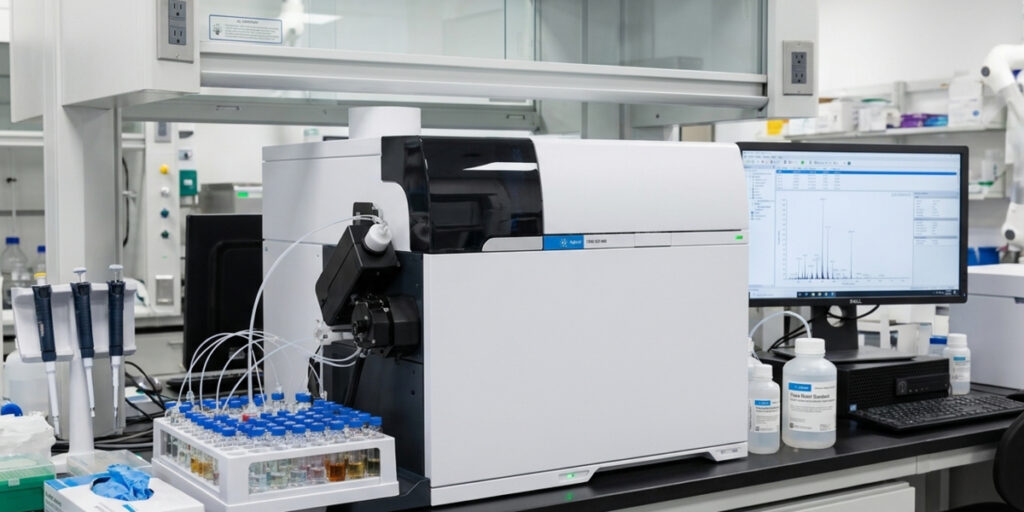
Controlled dissolution testing for pharmaceutical QC: Agilent 708-DS dissolution apparatus

For stability programmes, instrument-level variables must be controlled with the same rigour at month twelve as they are at initial release. The Agilent 708-DS addresses this directly.

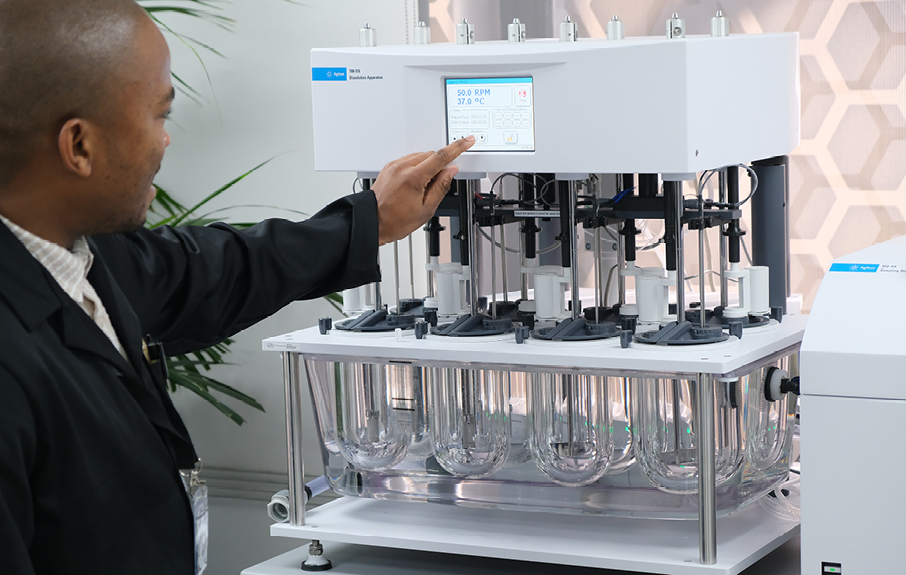
TruAlign vessels provide repeatable vessel-to-shaft centering, eliminating the asymmetric hydrodynamic profiles that contribute to stagnant zone formation and cone effect. AutoTemp in-vessel temperature monitoring confirms media temperature is maintained throughout the run. Programmable sampling depth eliminates vessel-to-vessel insertion depth variation. Dissolution Workstation Software provides electronic documentation and audit trail capability for 21 CFR Part 11 compliant environments.
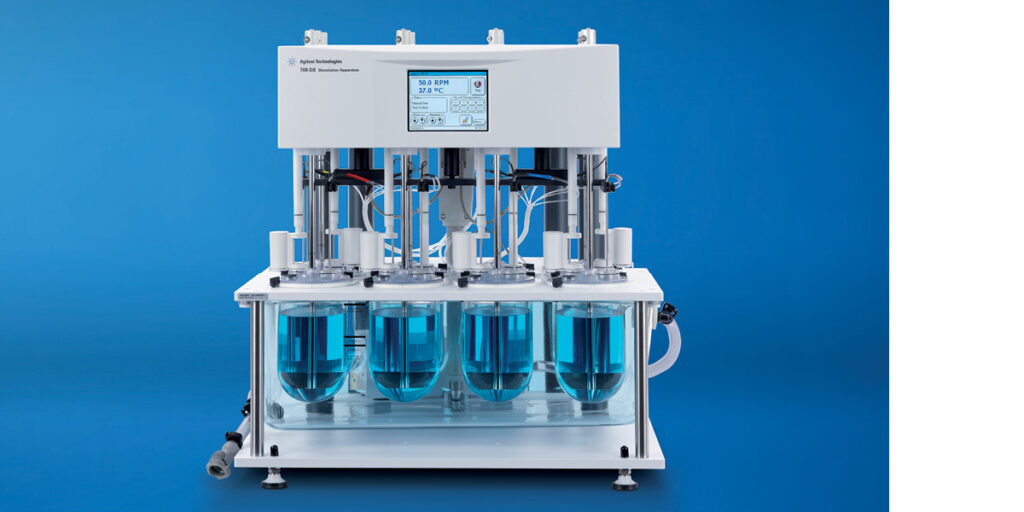
 

Agilent 708-DS

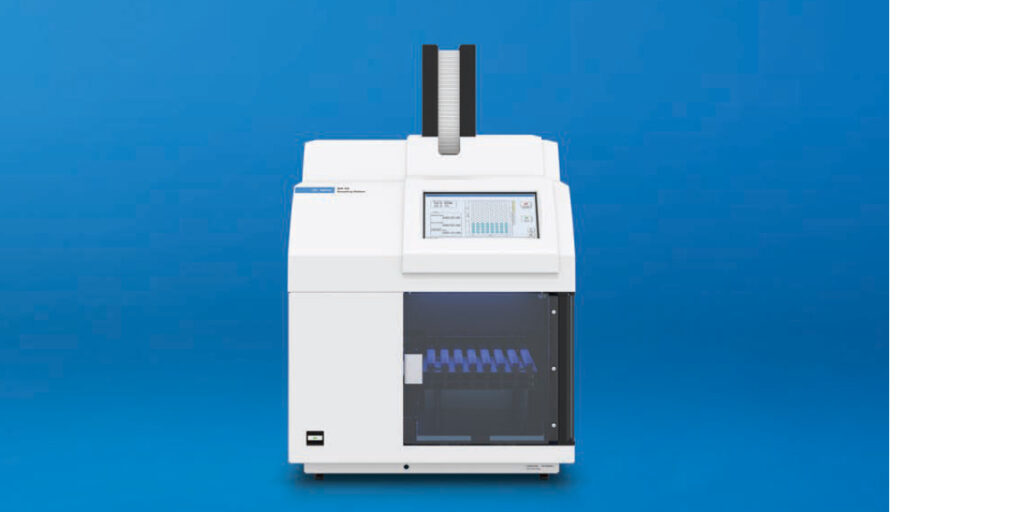
Automated sampling for reproducible stability data: Agilent 850-DS dissolution sampling station

The 850-DS removes the manual variables that amplify dissolution failures in stability testing. Automated withdrawal timing ensures every time point is sampled at the exact programmed interval across all six vessels simultaneously. Automated needle positioning ensures identical sampling depth at every vessel at every time point. Inline filtration at 0.2 or 0.45µm eliminates sample preparation variation from manual filter handling.

For the furosemide, montelukast and pioglitazone dissolution methods specifically, automated sampling is not a convenience. It is a methodological requirement. Detecting a developing stability failure before it becomes a recall requires a testing platform that removes the noise introduced by manual handling.

Practical resource: Agilent 850-DS product page

Speak to a Chemetrix specialist about configuring the 850-DS for your stability sampling volumes, filtration requirements and downstream analytical method.
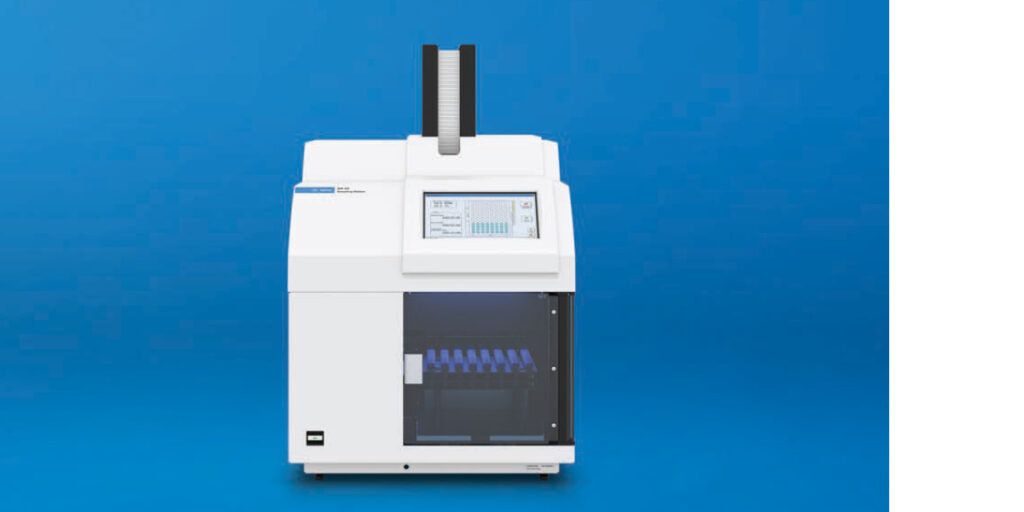
Agilent 850-DS

📥 Explore the full Agilent dissolution testing portfolio
Agilent dissolution testing resources

Passing release testing is the beginning of compliance, not the end of it

Three recalls. Three different storage mechanisms. One shared failure: a dissolution testing methodology not designed to detect the failure early enough to prevent it.

The analysts who run stability dissolution programmes deserve a workflow that is built to detect what needs to be detected; not a manual sampling process that introduces enough variability to mask a developing failure until it’s too late.

Chemetrix works with pharmaceutical QC labs across Southern and East Africa to design dissolution testing programmes built around the sensitivity and reproducibility that stability monitoring actually requires. The goal is dissolution data that defends the product at every stability time point, not just the first one.

Build your stability dissolution programme around the results you need to defend

Before your next stability pull, work through four questions:

  1. Does your method control vessel centering, paddle height and sampling depth reproducibly across analysts and time points?
  2. Are your stability time points sampled within the required interval across all six vessels simultaneously?
  3. Is your filtration consistent enough to distinguish a genuine dissolution change from a methodological artefact?
  4. Does your audit trail support a SAHPRA inspection or GMP compliance review?

Speak to a Chemetrix specialist about your stability dissolution programme:

  • Pharmaceutical QC labs: apparatus qualification, stability method validation and automated sampling configuration for SAHPRA GMP compliance
  • Generic drug development labs: dissolution method development and bioequivalence stability testing for BCS Class II and IV compounds
  • Contract testing labs: high-throughput stability dissolution workflows with HPLC integration and LIMS connectivity
  • Regulatory affairs and QA teams: dissolution data integrity review and method robustness assessment ahead of SAHPRA submissions

Your dissolution data is only as reliable as the stability programme behind it.


TL;DR

Lasix 80mg, Lumont 10mg and Cipla-Pioglitazone all passed initial release testing. All three were recalled from the South African market after dissolution failures at 6 or 12-month stability intervals. The root causes were different in each case but the pattern is the same: subtle physical changes during storage interact with uncontrolled dissolution testing variables to produce results that passing release testing cannot predict. Automated, end-to-end dissolution workflow control is the primary defence.

Pharmaceutical Dissolution Testing: Why Sampling Causes More Variability than the Apparatus

The dissolution apparatus has been validated. Media temperature is correct. Paddle speed is set. Everything looks right. And yet results from one analyst to the next are not as consistent as they should be.

This is one of the most common and least-discussed problems in pharmaceutical dissolution testing. The problem is almost never the apparatus. It is almost always what happens next: the sampling.

Dissolution testing determines how an active pharmaceutical ingredient is released from a dosage form under defined conditions. A failed or inconsistent result can delay batch release, trigger a data investigation and consume analyst time that could be spent elsewhere. When that variability traces back to sampling rather than the product itself it is a workflow problem, not a formulation problem. And it’s a solvable one.

Why does pharmaceutical dissolution testing produce variable results even when the method
is correct?

The apparatus controls the dissolution conditions. It does not control what happens when the sample leaves the vessel. That distinction is where most labs have a gap.

Manual sampling introduces variability at five distinct points: when the sample is taken, where in the vessel it is withdrawn from, how much is collected, how it is filtered and transferred, and how consistently that process is repeated across multiple vessels and time points. In extended-release products requiring sampling over several hours the opportunity for cumulative variation is significant.

The result is a dissolution profile that reflects the sampling process as much as the drug product itself. Chemetrix consultants see this pattern consistently across pharmaceutical QC labs: unexplained batch-to-batch variation traced back not to formulation but to manual sampling steps that were never formally controlled.

Dissolution testing explained

Every oral dosage form that reaches a patient has been through dissolution testing. The test simulates conditions the drug encounters in the body, exposing the finished product to a defined volume of media at controlled temperature and stirring speed, then measuring API release at defined time points.

Those results determine whether a batch is released for patient use. They underpin bioequivalence decisions in generic drug development and support regulatory submissions across USP, EP and JP pharmacopoeial frameworks. They are used throughout the product life cycle from R&D through to routine QC.

When dissolution data is compromised by sampling variability the consequences extend beyond a failed batch. They reach into data integrity queries, audit findings and regulatory submissions built on data that does not accurately reflect the product. The analytical lab’s responsibility is to produce dissolution data that reflects the drug, not the process of collecting the sample.


How can pharmaceutical QC labs reduce analyst-to-analyst variation in dissolution sampling?

Remove the manual steps. Not because analysts are careless but because repetitive manual sampling across six vessels at five or more time points is an inherently variable process regardless of analyst experience.

The labs that achieve the most consistent dissolution data are not necessarily the ones with the most skilled analysts. They are the ones that have replaced analyst-dependent sampling variables with automated controls. When timing, withdrawal position and filtration are managed by the sampling station the analyst is freed to review data, prepare subsequent runs and apply scientific judgement where it actually matters.

This is what Chemetrix means by treating dissolution as an end-to-end workflow. The apparatus handles dissolution conditions. The sampling station handles the rest. Both need to be
designed together.

Controlled dissolution testing for pharmaceutical QC: Agilent 708-DS dissolution apparatus

The Agilent 708-DS is the established platform for pharmaceutical dissolution testing across oral solid dosage forms, topicals, implants, transdermal patches and medical devices. It conforms to international pharmacopoeial specifications for Apparatus 1, 2, 5 and 6 and accommodates tablets, capsules, transdermal and semisolid formulations.

Key features that directly address variability at the apparatus level include TruAlign vessels for repeatable vessel orientation, motorised lift for integration with automated sampling systems, AutoTemp in-vessel temperature monitoring to confirm media conditions throughout the run and programmable sampling depth to eliminate vessel-to-vessel inconsistency in withdrawal position. The optional Dissolution Workstation Software provides electronic documentation of test parameters and audit trail capability for 21 CFR Part 11 compliant environments.

For labs requiring online UV analysis, the 708-DS pairs with the Agilent Cary 60 UV-Vis Spectrophotometer in multicell and fiber optic configurations enabling real-time dissolution profile monitoring without manual sample withdrawal at each time point.

Speak to a Chemetrix specialist about configuring the 708-DS for your specific dosage form and regulatory requirements.

Agilent 708-DS

Automated dissolution sampling for regulated pharmaceutical labs: Agilent 850-DS dissolution sampling station

The Agilent 850-DS Dissolution Sampling Station automates what the apparatus cannot control. It manages withdrawal timing, sampling position, filtration and sample collection into test tubes, HPLC vials or 96-well plates depending on the downstream analysis method.

For labs running HPLC analysis, samples collected by the 850-DS into Agilent HPLC trays can be placed directly into the HPLC autosampler without manual vial transfer. A validated end-to-end workflow demonstrated with multidrug capsules containing four APIs at different concentration ranges showed that the full sequence from dissolution sampling through LIMS integration to HPLC measurement and result reporting can be completed with minimal manual intervention. Barcoded vials scanned into the LIMS were automatically linked to vessel and time point data, passed to Agilent Sample Scheduler software and submitted to the LC instrument without the analyst managing the sequence manually.

The 850-DS includes an integrated syringe pump, optional filtration module for 0.2 or 0.45 µm filtration, variable pump speeds for different media types including surfactants, automated cleaning cycle and user access level controls to prevent unauthorised method changes.

Speak to a Chemetrix specialist about configuring the 850-DS for your sampling volume, filtration requirements and downstream analytical method.

Agilent 850-DS

📥 Explore the full Agilent dissolution testing portfolio

Dissolution data quality is a workflow decision, not just an instrument decision

There is a mindset Chemetrix consultants encounter regularly: that some variability between analysts or time points is an acceptable part of dissolution testing. That the apparatus is doing its job and the rest is just the nature of manual work.

It is not acceptable. Not when the data produced determines whether a product reaches a patient. The analysts running dissolution tests day after day under time pressure and throughput demands deserve a workflow that sets them up to produce reliable data consistently, not a process that makes accuracy dependent on replicating the previous analyst’s technique.

The labs that consistently produce defensible dissolution data treat sampling as a controlled variable from method design stage. They invest in the workflow that connects the apparatus to the result. Chemetrix works with pharmaceutical QC labs to design and supply that complete workflow, from instrument selection and qualification through to sampling automation and data management. The goal is dissolution data you can defend, not variability you have learned to explain.

How to diagnose dissolution sampling variability in your lab

Before assuming the problem is the product, work through four questions:
  1. Where is variability entering your sampling process? Timing, position, volume or filtration?
  2. Are your sampling time points being hit consistently across all vessels?
  3. How many manual transfer steps exist between the dissolution vessel and your analytical instrument?
  4. Does your current documentation trail support a 21 CFR Part 11 or GMP audit?
Speak to a Chemetrix specialist about your dissolution workflow:
  • Pharmaceutical QC labs: apparatus qualification, automated sampling configuration and Dissolution Workstation Software for 21 CFR Part 11 compliance
  • Contract research and testing labs: high-throughput dissolution workflows with HPLC integration and LIMS connectivity
  • Generic drug development labs: bioequivalence dissolution method development and semi-automated sampling for extended-release formulations
  • Compounding and hospital pharmacy labs: small-volume dissolution testing and method validation support for non-standard dosage forms

TL;DR

Most pharmaceutical labs assume that once the dissolution apparatus is correctly set up the test is essentially controlled. In practice sampling is where the majority of variability enters the workflow. Timing errors, inconsistent withdrawal depth and manual filtration steps all introduce analyst-to-analyst variation that the apparatus itself cannot prevent. The Agilent 708-DS Dissolution Apparatus combined with the 850-DS Dissolution Sampling Station automates these critical steps to produce more consistent reproducible dissolution data with significantly less manual intervention.div

Skip the Derivatisation: Reducing the Cost of Certified Aflatoxin Screenings

Every food safety lab running aflatoxin testing has faced the same budget conversation: the regulatory sensitivity limit is non-negotiable, but the instrumentation needed to reliably hit it keeps creeping toward LC-TQ territory. Aflatoxins B1, B2, G1, and G2 are some of the most tightly regulated mycotoxins in the food and feed industry, and getting a defensible result at single-digit parts-per-billion levels has traditionally forced a choice between two expensive paths: a triple-quadrupole mass spectrometer, or a fluorescence detector bolted to hardware-intensive post-column derivatisation.

This matters because that choice isn’t really about sensitivity. It’s about whether your lab’s capital budget and sample throughput get held hostage by a workflow that’s more complex than the chemistry actually requires.

Why do aflatoxins need derivatisation to be detected by fluorescence?

Aflatoxin B1 and G1 carry an unsaturated double bond in their structure that suppresses their natural fluorescent response under standard excitation conditions. Historically, labs got around this with post-column derivatisation, either electrochemical bromination or a dedicated photochemical UV reactor placed after the column, to chemically modify the molecule and boost its fluorescence enough to meet regulatory detection limits.

The problem is that this fix adds an entire extra subsystem to the LC pathway. Bromination cells and UV derivatisation lines mean more hardware to maintain, more failure points, and a meaningfully longer time-to-result on every single run, all to compensate for a sensitivity gap that newer detector technology has largely closed.


What’s the real risk in aflatoxin testing: Sensitivity or carry-over?

Sensitivity gets all the attention in budget discussions, but the operational failure mode that actually trips up most testing benches is carry-over. Aflatoxins are notoriously prone to adhering to surfaces within the LC flow path, particularly the sample loop and injection needle. Skip a rigorous washing step between injections, and trace residue from a high-concentration sample bleeds into the next run.

The result is a phantom peak, a signal that looks like a positive detection but is actually contamination from the previous injection. In a regulatory context, this isn’t a minor technical glitch. A false positive can trigger an unnecessary recall investigation; a false negative from masked carry-over can let a genuinely contaminated batch through. Getting the washing protocol right for both the sample loop and the needle isn’t a nice-to-have, it’s the detail that determines whether your data is defensible.


How does high-sensitivity fluorescence detection change the workflow?

A high-sensitivity UHPLC fluorescence detector changes the equation by addressing the sensitivity gap directly at the optical level instead of compensating for it with extra hardware downstream. A low-dispersion flow cell with a small internal volume keeps the analyte band tight as it passes through the detector, maximising peak height and signal-to-noise ratio without diluting the response across a larger cell volume.

That’s the mechanism that allows a fluorescence detector to reach single-digit ppb limits for all four aflatoxins without derivatisation. No bromination cell, no UV reactor, no second subsystem to validate and maintain, just a cleaner, simpler optical pathway doing the sensitivity work that used to require additional chemistry.

Simplifying compliance testing for regional Food safety labs

For commercial food testing facilities across Southern and East Africa running routine aflatoxin screening on grain, nuts, and animal feed, the case for skipping derivatisation isn’t theoretical, it’s a direct line to lower cost per sample and less unplanned downtime. Every derivatisation subsystem removed from the workflow is one less component that can fail mid-run and stall a queue of regulatory samples.

The Agilent 1290 Infinity III FLD, featuring an ultra-sensitive, low-dispersion 1.3 µL flow cell, is built specifically for this kind of high-throughput screening, hitting regulatory sensitivity thresholds without the hardware complexity of bromination or photochemical derivatisation.

📚 For labs evaluating whether their current detection limits hold up, the Agilent 1290 Infinity III FLD Aflatoxins Application Note (5994-8938EN) lays out the validated method conditions in full.

Protecting data integrity through proper system maintenance

Even the best detector can’t compensate for a contaminated flow path. For labs handling high sample volumes, particularly where aflatoxin concentrations vary widely between consecutive injections, a documented, rigorous washing protocol for the sample loop and injection needle should be treated as a core part of method validation, not an afterthought buried in a maintenance schedule.

Chemetrix application specialists work directly with regional labs to audit current wash-step protocols against the matrix and concentration ranges actually being tested, helping teams catch carry-over risk before it shows up as an inexplicable result during an audit. This is the kind of method-level detail that separates a workflow that’s merely fast from one that’s actually defensible.


Should labs just accept complexity as the cost of regulatory compliance?

No. There’s a quiet assumption in a lot of food safety labs that hitting trace-level sensitivity requirements simply requires more hardware, more steps, and a bigger budget. That assumption made sense when fluorescence detectors needed derivatisation to get there. It doesn’t hold anymore.

Is your aflatoxin workflow more complex than it needs to be?

If your lab is running, or considering, post-column derivatisation to hit aflatoxin sensitivity limits, it’s worth auditing whether that complexity is still necessary. A high-sensitivity UHPLC fluorescence detector can reach the same regulatory thresholds directly, while rigorous sample loop and needle washing protocols remain the real safeguard against false positives and phantom peaks.

For Lab Managers: Save this guide and review your current derivatisation setup against your actual sensitivity requirements.
For Evaluating Specialists: Download the 1290 Infinity III FLD Aflatoxins Application Note (5994-8938EN) to audit your current detection limits against validated method data.
For Compliance Custodians: Talk to a Chemetrix specialist about documenting your carry-over prevention protocol as part of your audit-ready quality controls.

TL;DR

Reaching single-digit ppb sensitivity for aflatoxins B1, B2, G1, and G2 has traditionally meant either buying an expensive LC-TQ system or adding complex post-column derivatisation hardware. A high-sensitivity UHPLC fluorescence detector skips both, hitting regulatory sensitivity limits directly. The biggest operational risk isn’t sensitivity at all, it’s column and injection-system carry-over, which causes phantom peaks and false positives if sample loop and needle washing protocols are neglected.

Conquering the Bias: A Pragmatic Guide to Navigating ICP-MS Interferences

Your instrument tuned cleanly. Your calibration looked fine. And yet your arsenic CRM is sitting at 148% recovery. Your zinc is at 130%. You have replaced the tubing, pulled the cones and run the diagnostics. Nothing has changed.

Before you take the instrument offline, check your matrix. In most cases the instrument is doing exactly what it is designed to do, measuring every ion that arrives at the detector. The problem is that some of those ions are not the analytes you are looking for.

Consistent deviation from a CRM expected value is not random error. It is systematic bias. And in ICP-MS, systematic bias has a name: spectral interference.

Why does my ICP-MS keep showing positive bias on CRM results?

There are three distinct types of spectral interference in ICP-MS: isobaric, polyatomic and doubly charged. They behave so differently from each other that applying the same correction to all three is one of the most common sources of persistent data errors in trace metal workflows.

Most labs treat interference as a single problem. It is not. Identifying which type you are dealing with is the first decision, and it determines everything that follows.

What are the three types of spectral interference in ICP-MS?

Interference Type
What It Is
Common Source
How to Address It
Isobaric
A different element shares the same nominal mass as your analyte.
¹⁰⁰Mo overlapping ¹⁰⁰Ru. ⁵⁸Ni overlapping ⁵⁸Fe.
Select an alternate interference-free isotope. Usually the simplest fix.
Polyatomic
A molecular ion formed in the plasma or matrix shares the same m/z as your analyte. The most common and disruptive type.
⁴⁰Ar³⁵Cl⁺ overlapping ⁷⁵As⁺. ⁴⁰Ca¹⁶O⁺ overlapping ⁵⁶Fe⁺. SO and ArN species in complex matrices.
Helium collision mode with KED. Suppresses all polyatomic species simultaneously, the right default for multi-element workflows.
Double Charge (M²⁺)
A doubly charged ion appears at half its true mass, directly on top of a different analyte. The quadrupole cannot tell the difference.
¹³²Ba²⁺ at m/z 66 overlapping ⁶⁶Zn⁺. REE²⁺ ions overlapping Zn, As and Se.

Mathematical correction using known isotope abundance ratios. KED does not remove M²⁺ ions. Agilent MassHunter automates this via the REE²⁺ Correction tool.

 

Critical distinction: KED helium collision mode eliminates polyatomic interferences but passes doubly charged ions straight through. If you are running helium mode and still seeing bias on Zn, As or Se in a barium or REE-containing matrix, M²⁺ ions are the likely cause.

What do labs miss most often when troubleshooting CRM bias?

Different matrices produce different interferences. A drinking water sample and a rare earth-rich geological digest require completely different correction strategies, even when measuring the same analyte panel.

A soil digest high in iron and sulphur generates SO and FeO polyatomic species that simply do not exist in a clean water matrix. A barium-rich industrial sample creates M²⁺ doubly charged ions that overlay zinc and arsenic signals at concentrations producing significant bias. Running both on the same uncorrected method will give you wrong results for at least one of them.

The pattern Chemetrix consultants see most often: a lab sees consistent CRM bias, assumes the instrument is drifting and spends time on maintenance that changes nothing. The root cause is almost always a matrix-interference mismatch that was never addressed at method design stage. Across hundreds of labs and 45 years of consultancy, that pattern has not changed.

Why does spectral interference matter beyond the lab?

Every result that leaves a lab feeds a decision someone else will make. Whether water is safe to drink. Whether a pharmaceutical batch is fit for release. Whether a food product clears the export standard it was tested against.

ICP-MS trace metal analysis sits at the centre of some of the most consequential testing work in any industry. Water quality laboratories measure arsenic, lead and cadmium against regulatory limits that protect public health. Food safety labs detect contaminants at parts-per-billion levels that determine whether a product is recalled or released. Mining and environmental labs produce the data that shapes compliance decisions and community safety outcomes.

When spectral interference goes unmanaged, those results carry a hidden bias that nobody has accounted for. The number looks credible. It passes review. And the decision downstream is made on a result that was never accurate.

This is why Chemetrix treats interference management as a method design requirement, not an afterthought. Labs do critical work. That work deserves the analytical foundation to stand behind it.

How can labs reduce rerun rate and improve first-pass accuracy in ICP-MS?

Manually identifying and correcting three different interference types across every batch in a production environment is not a sustainable workflow. This is where Chemetrix solution design and Agilent MassHunter work together to build interference management into the method itself, not into the troubleshooting process after the fact.

The labs that see the biggest efficiency gains are the ones that stop treating interference correction as a reactive response to a failed CRM and start treating it as a structured part of method development. That shift, from reactive to designed, is where first-pass accuracy improves, rerun rates fall and analyst time stops being absorbed by troubleshooting that should not be necessary.

Polyatomic interference management for environmental and food safety labs

Environmental and food safety labs routinely analyse complex variable matrices where polyatomic interferences are unpredictable and differ significantly from sample to sample. Chloride-driven ArCl species are the most common source of arsenic bias in food matrices. SO and FeO species are the primary drivers of bias in soil digests and wastewater. Mathematical correction is not reliable across matrices this variable.

The correct approach is helium collision mode with Kinetic Energy Discrimination, available as a standard cell gas mode on the Agilent 7850, 7900 and 8900 ICP-MS. MassHunter manages cell gas flow, voltage discrimination and acquisition automatically. The analyst does not need to identify which polyatomic species are present in each sample type. Helium KED suppresses them collectively, making the method robust across rotating matrices without reconfiguration.

Doubly charged ion correction for mining and industrial labs

Mining, geological and industrial labs analysing samples with high barium or rare earth element concentrations face a different problem entirely. Doubly charged ions are not affected by helium collision mode. They pass through the cell unaffected and land directly on analyte masses at half their true m/z. At 5,000 ppb barium, zinc recovery reaches 130% without correction. At 5 ppb gadolinium and dysprosium, selenium recovery reaches 215%.

Agilent MassHunter’s REE²⁺ Correction tool resolves this automatically. Because all isotopes of an element form doubly charged ions at the same natural abundance ratio, MassHunter monitors specific half-mass m/z positions and subtracts the M²⁺ contribution from affected analyte signals in real time. Configured once in the Method Wizard. Validated recovery data: zinc from 130% to 96%, selenium from 215% to 107%.

📥 Download the Agilent Technical Overview: full correction equations for Zn, As and Se, validated recovery data across Ba and REE matrices and instrumentation requirements.

Why the best labs do not just cope with complexity, they design around it

There is an expectation in some labs that interference management is something you deal with when things go wrong. You run the batch, a CRM fails and then you troubleshoot. It is reactive, time-consuming and it puts the burden of a method design problem onto the analyst running the sample.

The people doing this work deserve better than that. Analysts should not be spending their time compensating for a method that was never built to handle the matrix it is routinely running. Lab managers should not be explaining to clients why results from last week need to be reissued. Quality teams should not be discovering interference bias during an audit.

Chemetrix has spent 45 years working inside laboratories across Southern and East Africa. The labs that consistently produce accurate, defensible trace metal data share one thing: they treat interference management as part of the method, not the troubleshooting queue. They build the correction in from the start, they validate it against their actual matrices and they do not rely on analysts to catch what the method should be preventing.

That is the standard Chemetrix designs to. And it is the standard every lab running ICP-MS trace metal analysis should be able to work from.

Next time your CRM does not cooperate, start here

Before assuming instrument fault, work through four questions:

  1. What is in my matrix at high concentration? Barium, rare earths, chloride, sulphur or calcium?
  2. Which analytes are consistently high? Map the pattern against the three interference types above.
  3. Which correction mode is active? KED helium addresses polyatomics but does not remove doubly charged ions.
  4. Is M²⁺ correction configured in MassHunter? If your matrix contains Ba or REEs and you are seeing bias on Zn, As or Se, it should be.

Speak to a Chemetrix specialist about your specific matrix:

  • Environmental and water labs: chloride and sulphur matrix interference strategy for As and Se.
  • Mining and geological labs: M²⁺ correction configuration for REE-rich sample types on Agilent 7900 or 8900.
  • Food safety labs: ArCl and SO polyatomic species remain the most common source of arsenic and selenium bias.
  • Pharmaceutical labs: method validation for elemental impurity testing under ICH Q3D including interference correction requirements for complex matrices.

TL;DR

When your ICP-MS CRM results show consistent positive bias, spectral interference is almost always the cause, not instrument failure. There are three distinct types (isobaric, polyatomic and doubly charged) and each requires a completely different correction approach. Agilent MassHunter automates the fix, but only if you know which type you are dealing with.

Up the Stack: Why the Real Frontier of AI Lives Between Your Laboratory Instruments

A single high-resolution instrument run can generate several gigabytes of data in minutes. That sounds like progress, and it is, until that data sits isolated in a proprietary format that nothing else in the lab can read without manual intervention. This is the quiet ceiling that modern laboratories are hitting: the first wave of “smart” instrument features, automated peak integration, predictive maintenance alerts, solved real problems inside individual instruments, but they never solved the problem between them.

For lab directors, IT architects, and operations managers, this matters because the next phase of laboratory digital transformation isn’t about smarter instruments. It’s about whether the software stack above those instruments can finally talk to all of them at once.

Why do “smart” lab features stop solving problems at the instrument level?

Automated peak integration and predictive maintenance alerts were a genuine step forward; they reduced manual review and caught failures before they became downtime. But Chemetrix’s consultants have seen the same pattern repeat across regional labs: once those features are deployed, the bottleneck doesn’t disappear. It moves. The constraint shifts from “is this instrument performing well” to “can this instrument’s data talk to the next system in the workflow.”

A chromatography system might integrate its own peaks flawlessly and still hand off a result that a LIMS, an ELN, or a second instrument can’t parse without a manual export-and-reformat step. The smart feature did its job. The workflow around it didn’t get any smarter.

Why does fragmented lab data matter beyond the bench?

The instruments driving modern science, high-resolution mass spectrometers, multi-detector chromatography systems, generate data at a scale that simply didn’t exist a decade ago. A single run can produce several gigabytes of fragmented output, structured around a specific vendor’s proprietary format rather than the workflow the data is meant to serve.

This isn’t just an IT inconvenience. Every manual reformatting step is a point where data can be transcribed incorrectly, where context gets lost, and where audit trails become harder to defend. In regulated GxP environments, this kind of fragmentation isn’t a productivity issue, it’s a compliance exposure waiting to surface during an audit.

How does declarative orchestration differ from standard lab integration?

Most current lab integration is imperative: an IT team manually maps Instrument A’s output format to Instrument B’s expected input, instrument by instrument, vendor by vendor. It works, but it’s rigid. Every new instrument, every software update, every vendor change requires re-mapping the connection by hand.

Declarative orchestration works differently. An analyst sets a scientific goal, “run this sample through this workflow”, and the software layer coordinates the instrument fleet to execute it, regardless of which vendor built which piece of hardware. This shift is only possible when the data underneath is described using open, vendor-neutral standards rather than proprietary formats that lock data inside a single system.

This is where frameworks from the Allotrope Foundation, the Pistoia Alliance, and SiLA become directly relevant. The Allotrope Foundation promotes industry standards that enhance data interoperability, aligning laboratory data practices with FAIR and ALCOA+ principles to support data integrity and compliance. SiLA promotes AnIML, a basic-level data format that counters the problem of lab instruments speaking different languages, aiming to align communication between manufacturers using a shared XML-based data format. Together, these standards are what let agentic AI move from a chatbot overlay sitting on top of a single system to genuine cross-instrument orchestration

Closing the data gap for pharmaceutical and GxP labs

For regulated pharmaceutical environments, the stakes around data fragmentation are highest. A multi-step QC workflow that spans HPLC, mass spectrometry, and a LIMS needs every handoff to be defensible during an audit, not just functional day to day.

The Pistoia Alliance’s MethodDB project, developed in collaboration with the Allotrope Foundation and partners including Agilent, Merck, and Bristol-Myers Squibb, uses the Allotrope Data Format to standardise how analytical method descriptions are recorded, increasing data integrity and scientific reproducibility. This kind of standardisation is precisely what reduces the change-management burden GxP labs face when adopting any new automation layer, the data structure underneath stays consistent even as the tools on top evolve.

Chemetrix application specialists work directly with regulated labs across the region to assess where data handoffs currently rely on manual reformatting, and to map a practical path toward standards-based interoperability without disrupting validated workflows already in place.


Improving cross-site asset utilisation for multi-lab operations

For organisations running multiple lab sites, instrument-level smart features solve a single-site problem while leaving a bigger one untouched: knowing which instruments across the network are actually available, and routing samples to them efficiently.

This is the orchestration layer gap that the broader industry has started naming directly. Coordination “still happens in calendars and email threads” in many R&D organisations, even where individual instruments are highly automated. Declarative orchestration, built on open data standards, is what allows a scheduling system to see instrument availability across sites and route work accordingly, rather than relying on a person manually checking which lab has capacity.

For multi-site operations evaluating this shift, Chemetrix can walk through a practical asset-utilisation audit, identifying where standards-based data exchange would unlock cross-site scheduling that today depends on manual coordination.

Should labs treat agentic AI as a cure-all for workflow problems?

No, and treating it that way is precisely the steep change-management trap that catches labs out. Agentic AI is only as effective as the data structure underneath it.

Agentic AI systems capable of autonomous planning, tool use, and multi-step reasoning represent a genuinely transformative shift, but the implications come with real governance challenges: how decisions are validated, how audit trails are maintained, and what infrastructure is needed to deploy agents safely at scale. A chatbot layered on top of fragmented, vendor-locked data doesn’t solve the underlying problem, it just adds a conversational interface to the same broken handoffs.

This is the cultural shift Chemetrix advocates for: building the data foundation first, with open standards and genuine interoperability, rather than reaching for an AI overlay as a shortcut around the harder infrastructure work. Labs that get this sequence right end up with systems that are auditable, defensible, and genuinely faster. Labs that skip ahead end up with an impressive demo and the same fragmented data problem underneath.

What should lab directors and IT architects do next?

The shift from instrument-centric benches to integrated, workflow-first ecosystems isn’t optional for labs that want to capture real efficiency gains, but it does require sequencing the work correctly: assess where data handoffs are currently manual, prioritise standards-based interoperability over point-solution AI overlays, and treat regulated change-management requirements as part of the plan from the outset, not an afterthought.

For Lab Directors: Save this guide and start mapping where your current workflow relies on manual data reformatting between instruments.
For IT Architects: Talk to a Chemetrix specialist about evaluating your lab’s readiness for open-standards-based data exchange.
For Operations Managers: Request an asset-utilisation audit to identify where declarative orchestration could improve cross-site scheduling and turnaround time.


TL;DR

First-generation “smart” lab features, automated peak integration, predictive maintenance alerts, solve problems inside a single instrument, but they don’t solve the data gaps between instruments. The real bottleneck is fragmented, vendor-locked data. Open standards like Allotrope, SiLA and the Pistoia Alliance’s frameworks are what let labs move from imperative integration (manual, rigid data mapping) to declarative orchestration, where an analyst sets a scientific goal and software coordinates the fleet, improving turnaround, compliance,
and asset utilisation.

From Weighing to Waste: Streamlining High-Stakes Food and Cannabis Testing with All-in-One Automation

Out-of-spec batches rarely start with a hardware failure. They start at the bench, in the five minutes before a sample ever reaches an instrument. Manual QuEChERS vortexing and multi-step solid-phase extraction are foundational to cannabis and food pesticide testing, but they’re also where the most preventable variance enters a lab’s data.

This matters because the instrument gets the credit when results are accurate, and the blame when they’re not, even when the actual point of failure was a sample prep step that two different analysts performed two different ways. For labs under regulatory turnaround pressure, understanding exactly where that variance originates is the first step to removing it.

Where does analyst variance actually enter the sample prep workflow?

Chemetrix consultants see the same pattern across regional food safety and cannabis testing labs: the analytical instrument is rigorously validated, but the sample preparation feeding it is governed by habit, not protocol. Manual QuEChERS extraction depends on shaking intensity and duration that vary from person to person and shift to shift. Centrifugation speed and timing, layer separation technique, and even how long a sample sits before processing all introduce small inconsistencies that compound across a batch.

None of this shows up as an obvious error. It shows up as drifting recovery rates, inconsistent RSDs, and a lab manager trying to explain why the same method produced different results on different days, with no clear root cause to point to.


What’s actually happening to the sample matrix during extraction and cleanup?

Cannabis and complex food matrices are chemically demanding to work with. Pigments like chlorophyll and carotenoids, along with waxes and other co-extractives, need to be removed during cleanup without stripping out the target pesticides alongside them. This is a genuinely difficult balance, and it’s why the physical variables in manual prep matter so much: pipetting accuracy affects how much sorbent or solvent reaches the sample, evaporation rate affects how concentrated or degraded an extract becomes, and centrifugal consistency determines whether phase separation is clean or compromised.

When these variables shift slightly between analysts, the chemistry shifts with them, sometimes enough to push a result above or below a regulatory threshold for reasons that have nothing to do with the actual sample.

How does standardising sample prep actually improve lab efficiency?

The efficiency gain from automating sample prep isn’t just about saving hands-on time, though that matters too. It’s about removing the variable entirely so that every sample, regardless of which analyst loaded it or which day it ran, goes through an identical physical and chemical process. Chemetrix’s work designing complete sample prep solutions across regional labs consistently shows that standardisation, not faster individual steps, is what actually closes the gap between a method that works in validation and one that holds up in routine high-throughput use.

This is also where sourcing matters. A lab juggling QuEChERS salts, SPE cartridges, and pesticide reference standards from multiple suppliers loses time before testing even starts, reconciling part numbers, managing inventory gaps, and troubleshooting inconsistent batches of consumables that were never designed to work together as a system.

Automating QuEChERS extraction for pesticide residue Testing

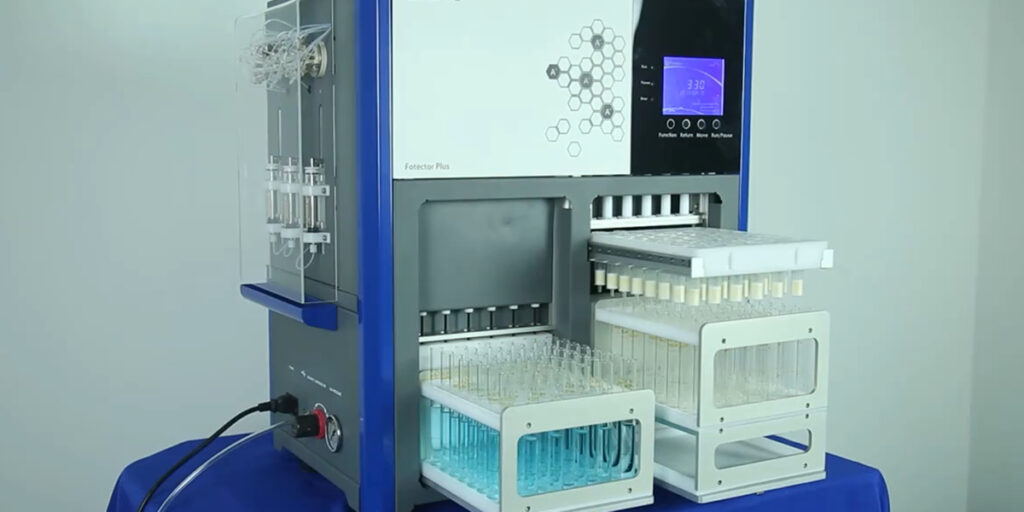
For labs running high-volume pesticide residue testing in food and cannabis matrices, the Raykol Automated DRQ QuEChERS system addresses analyst variance directly by automating the entire extraction sequence, solvent addition, salt addition, vortexing, centrifugation, and layer separation, in a single workstation. Only sample weighing remains manual, which means every other physical variable that previously depended on individual technique is now executed identically, run after run.

The system supports up to 60 samples per batch and 120 samples per day, with fully programmable workflows that can be adjusted for pesticides, veterinary drugs, or herbal matrices depending on the lab’s testing scope. For labs evaluating this transition, Chemetrix offers complete, pre-verified consumable kits covering QuEChERS extraction salts, SPE cleanup products, and certified pesticide reference standards, all matched to the DRQ workflow on a single ordering guide, removing the multi-vendor sourcing overhead entirely.

Eliminating cleanup variance through integrated SPE and evaporation

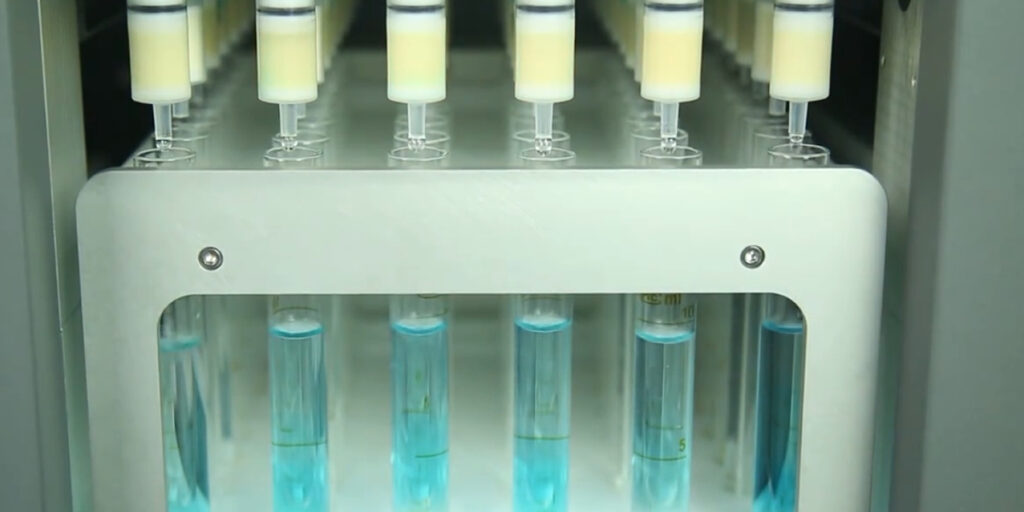
Solid-phase extraction cleanup is typically a multi-step manual process, loading cartridges, controlling flow rate, evaporating eluent, and reconstituting the sample, each step introducing its own opportunity for inconsistency. An integrated SPE and evaporation system performs purification, concentration, solvent exchange, and reconstitution within a single automated platform, removing the manual handoffs between steps that are most prone to analyst-to-analyst drift.

This kind of integration is particularly valuable for labs handling viscous or matrix-heavy samples, where manual evaporation timing is one of the hardest variables to keep consistent. Chemetrix application specialists work directly with regional labs to map current SPE workflows against automated configurations, and can also walk teams through a related webinar on cannabis and food matrix cleanup strategy for labs evaluating the transition.

Should labs accept analyst variance as a normal cost of manual testing?

No. There’s a quiet assumption in a lot of labs that some degree of analyst-to-analyst variance is simply the price of running a busy testing operation. It isn’t. It’s a solvable workflow design problem, not an inevitable feature of working with people instead of robots.

Chemetrix’s role isn’t to suggest that automation replaces skilled analysts, it’s to free those analysts from manually executing repetitive physical steps that machines perform more consistently, so their expertise goes toward method development, troubleshooting and the judgment calls that actually require a trained scientist. That’s the standard Chemetrix holds its sample prep solutions to: protecting the lab’s long-term data integrity, not just its short-term throughput numbers.

What should your lab do next to standardise sample prep?

Out-of-spec batches and inconsistent recovery rates are rarely an instrument problem. More often, they trace back to manual sample preparation steps that vary between analysts in ways that are easy to overlook and difficult to diagnose after the fact. Automating QuEChERS extraction and SPE cleanup removes that variance at the source, while complete consumable kits eliminate the sourcing friction that slows labs down before testing even begins.

For Lab Managers: Save this guide and review where your current sample prep workflow relies on individual analyst technique rather than a standardised protocol.
For Evaluating Specialists: Request application guidance on matching the Raykol DRQ or integrated SPE-evaporation system to your specific matrix and throughput requirements.
For Compliance Custodians: Talk to a Chemetrix specialist about documenting standardised sample prep protocols as part of your audit-ready quality controls.


TL;DR

Manual QuEChERS extraction and multi-step SPE cleanup introduce measurable analyst-to-analyst variance, in shaking intensity, centrifugal consistency, and evaporation timing, that drives inconsistent pesticide recovery and out-of-spec batches. Automated platforms like the Raykol DRQ QuEChERS system and integrated SPE-evaporation workstations remove that variance entirely, while complete, pre-verified consumable kits eliminate the sourcing overhead that slows labs down before testing even begins.

The Crippled Treatment Works

A municipal district in Gauteng plunges into a public health emergency. Dozens of lives lost, hundreds hospitalised, local food producers forced to halt production over unpotable water, and a municipality facing serious legal and compliance liability over a failing utility grid.

This isn’t a hypothetical. It’s the pattern behind real waterborne disease outbreaks linked to wastewater infrastructure failure and at the centre of it is a testing gap that’s entirely preventable.

By the time legacy laboratory methods confirm contamination, the public has often already consumed the water. This matters for every lab and utility responsible for drinking water safety, because the difference between catching contamination in hours versus days is the difference between an isolated incident and a catastrophe.

What happens when a wastewater treatment plant fails?

An over-capacitated, poorly maintained wastewater treatment plant operating far above its design limits doesn’t just underperform, it actively becomes the source of the crisis. Instead of discharging treated, compliant effluent, the dysfunctional plant releases millions of litres of partially treated sewage directly into the river system feeding a downstream drinking water purification plant.

This is rarely a sudden failure. It’s the result of ageing infrastructure, deferred maintenance, and a system running past its intended capacity for years before the consequences become visible at the tap.


How does E. coli contamination escalate from “manageable” to “catastrophic”?

The daily reality of this kind of failure isn’t measured in headlines, it’s measured in microbiological density. Upstream of a failing wastewater plant, a river might carry a manageable 5,000 CFU of E. coli per 100ml. Downstream of the same plant, that number can rocket to 1,000,000 CFU per 100ml.

This overwhelming biological load depletes dissolved oxygen in the river ecosystem and introduces highly pathogenic strains that overwhelm standard sand filtration and multi-barrier chlorination at the downstream drinking water plant, allowing coliforms to enter the reticulation network and reach the public.

Why is legacy water testing too slow to prevent an outbreak?

Traditional water testing relies on retrospective culture methods, incubating samples and waiting for bacterial growth to confirm contamination. The problem isn’t the accuracy of this method. It’s the timeline. Culture-based testing can take days to deliver results, and during a wastewater infrastructure failure, days is exactly the window in which the public is already drinking contaminated water.


By the time a lab confirms the failure, the exposure has already happened.
The diagnostic gap, not a lack of awareness, is what turns a fixable infrastructure problem into a public health emergency.

How does rapid water quality testing close that gap?

The fix isn’t more frequent legacy testing, it’s a fundamentally faster method. High-throughput enzymatic assays and rapid Quantitative PCR (qPCR) screens detect shifting microbial index markers and indicator spikes within hours rather than days, aligned strictly to SANS 241 drinking water standards.

That speed changes what’s possible operationally. Lab managers can use same-day data to alter chemical dosing, isolate affected reservoirs, and flag a wastewater failure before it cascades into a full-scale contamination event, turning a containable infrastructure problem back into exactly that, instead of a human catastrophe.


Should municipal and industrial labs rethink their testing protocols?

For utilities, municipal labs, and the commercial industries that depend on potable water supply, food and beverage producers especially, relying solely on legacy culture testing is a defensible-sounding but operationally risky position. “We tested it” isn’t the same as “we tested it fast enough to act.” Rapid, automated profiling aligned to SANS 241 gives labs the diagnostic speed that legacy methods were never built to provide.

FAQ

How fast can rapid water testing detect contamination compared to traditional methods?

Rapid qPCR and enzymatic assays can detect microbial contamination within hours, compared to days for traditional culture-based testing methods.

What is SANS 241?

SANS 241 is South Africa’s national drinking water quality standard, setting the microbiological, chemical, and aesthetic limits water must meet to be considered safe for public consumption.

Why does E. coli concentration matter for water safety?

High E. coli concentrations indicate faecal contamination and the likely presence of other pathogenic bacteria, signalling a direct health risk to anyone exposed to the water.

What should your lab do before the next wastewater failure?

When wastewater infrastructure fails, the difference between a contained incident and a public health catastrophe often comes down to testing speed. Legacy culture methods confirm contamination days too late. Rapid, SANS 241-aligned qPCR and enzymatic screening close that gap to hours — giving lab managers and utilities the window they need to act.


TL;DR

A failing municipal wastewater plant can push E. coli levels from 5,000 to 1,000,000 CFU/100ml downstream, overwhelming drinking water filtration and triggering public health crises. Legacy culture-based testing detects this days after exposure. Rapid qPCR and enzymatic assays, aligned to SANS 241, flag contamination within hours, giving labs the window to act before a wastewater failure becomes a human catastrophe.

Beyond the Quartz Waterline: The True Cost of Chemical Attack in High-TDS ICP–OES Analysis

It’s 4:30pm on a Friday, and your calibration standards have started drifting. Not failing outright, just enough to make you squint at the screen and wonder if it’s the method, the standards, or something else entirely. You’ve run high-TDS samples all week. You already know what you’ll find when you pull the torch: a faint haze of devitrification creeping up the quartz, the first sign that your “reliable” consumable has quietly started lying to you.

This is one of the most common, and most under-discussed, failure points in ICP-OES analysis. Standard quartz torches are excellent components, but they were never built to survive sustained exposure to high total dissolved solids (TDS), complex organic matrices, or heavy alkaline-earth and alkali metal loads (Li, Na, K, Ca, Mg, Rb, Cs). When labs run these matrices routinely, the torch becomes the silent variable behind drifting baselines, unexplained reruns and consumable budgets that never seem to add up.

This matters because most labs are still buying consumables on sticker price, not on cost per sample and that one decision is quietly driving the downtime, rework and accuracy issues everyone blames on “the instrument.”

Why does my ICP-OES torch keep failing on high-matrix samples?

Every analyst who’s run high-matrix samples for any length of time has lived this story. You start the week with a torch that performs beautifully. By Wednesday, you’re seeing slightly elevated background noise. By Friday, the quartz has started to devitrify, that cloudy, crystalline degradation that happens when alkaline-earth salts attack the silica structure under plasma heat. The glass becomes structurally weaker, more porous, and less optically clean, and your results start drifting in ways that don’t show up until you’ve already reported a few batches.

The instinctive response in most labs is to try to revive it: scrub it, soak it, polish it, swap in a “spare” that’s already half-degraded. Chemetrix consultants see this pattern across hundreds of labs in the region, teams spending real hours trying to nurse a structurally compromised torch back to usable condition, when the real fix has nothing to do with cleaning technique and everything to do with material selection. It’s not a bad habit. It’s a consumable mismatched to the matrix.


Why does quartz fail but ceramic doesn’t?

It’s easy to think of a torch as just a piece of glassware sitting inside an instrument. But every high-TDS or alkaline-earth-rich sample that runs through a degraded torch is, somewhere downstream, a decision that affects someone outside the lab. A mining company relies on accurate trace metal data to prove environmental compliance. A food producer relies on it to confirm a batch is safe to ship. A water utility relies on it to confirm a community’s tap water meets safety limits. None of those decisions are better than the data behind them, and that data is only as good as the consumable it passed through.

This is the part of analytical chemistry that rarely gets discussed outside the lab: the instrument doesn’t make the result trustworthy, the entire chain does, right down to whether the torch was chemically stable enough to deliver a clean, repeatable plasma. When a torch is quietly devitrifying, the risk isn’t just rework for the analyst, it’s a small crack in the chain of trust between a lab result and the public decision built on top of it.

That’s exactly why Chemetrix exists in this conversation, not to sell glassware, but to make sure the science underneath these decisions is as solid as the stakes riding on it.

Is a cheaper ICP-OES torch actually cheaper?

Quartz wins on the quote. But the real cost shows up later, in reruns, manual cleaning hours, replacement downtime, and accuracy risk from consumables run past their usable life. Compare cost per sample instead of cost per torch, and silicon nitride ceramic outer tubes, lasting up to 10x longer than quartz, win decisively.

How do you streamline a high-matrix ICP-OES workflow?

Most labs set their torch configuration once at installation and never revisit it as sample types change. Chemetrix’s solution design experience points to a simple fix: match outer tube and injector material to the matrix before degradation starts, and use demountable platforms so only the stressed component needs replacing.

Best torch setup for mining and environmental labs

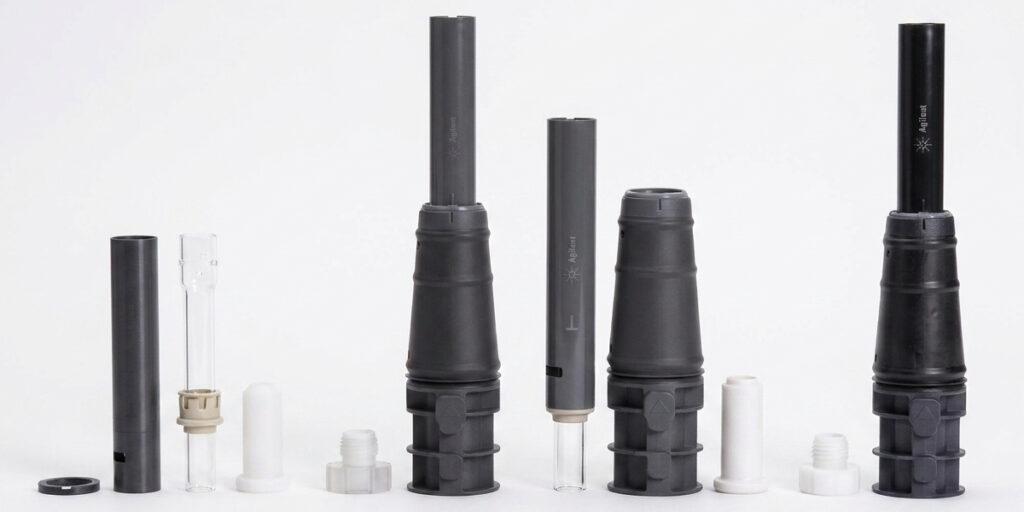
Mining and environmental labs run heavy alkaline-earth, high-TDS matrices that strip standard quartz fastest. The Agilent 5800/5900 Series ICP-OES with demountable torches and silicon nitride ceramic outer tubes lets labs replace only the stressed component. See the 5000 Series Quick Reference Guide or watch the demountable torch video.

Agilent 5900 ICP-OES

Preventing injector damage in food, beverage, and petrochemical testing

Complex organic matrices attack injector material rather than the outer tube, causing drift and blockages. Agilent’s full-range alumina injectors let labs configure a torch matched to organic-heavy samples without sacrificing durability. See the vertical torch technical overview, or talk to a Chemetrix specialist.


Should labs just “cope” with outdated systems?

Frequent torch failure isn’t just part of the job, it’s a symptom of consumable choices built around short-term cost. Chemetrix exists to challenge that: helping labs build a culture of integrity, accuracy, and respect for the people doing the work, starting with the right consumable, chosen properly.

What should you do next to protect your ICP-OES accuracy and uptime?

Recurring drift, frequent torch replacement, and hours lost to manual cleaning point to one culprit: the consumable, not the method. Silicon nitride ceramic and full-range alumina injectors offer up to 10x the lifespan of quartz, with less downtime and better accuracy.


TL;DR:

Standard quartz ICP-OES torches degrade quickly under high-TDS, alkaline-earth, or complex organic matrices, driving baseline drift, reruns, and downtime. Agilent’s silicon nitride ceramic outer tubes last up to 10x longer than quartz and full-range alumina injectors resist chemical attack; together lowering true cost per sample and protecting accuracy.

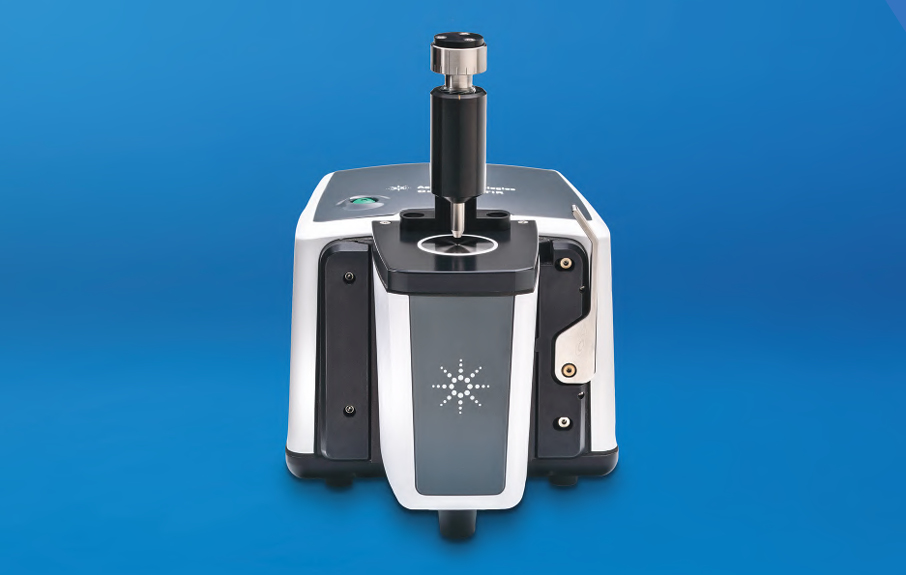
How to Get Reliable FTIR Identification Every Time with the Agilent Cary 630

Your raw material just failed its FTIR identity check. The match score came back at 87%, the batch is on hold and three people are standing around a spectrometer debating whether to reject a container of perfectly good excipient.

Here is the hard truth: in most cases, the material is fine. The instrument is fine. The problem is a misunderstanding of what FTIR matching actually measures, and it is costing pharmaceutical QC labs hours of unnecessary retesting, false rejections and eroded confidence in a technology that is genuinely excellent at its job.

This article unpacks the three real causes of low match scores, what FTIR can and cannot tell you, and how to build a workflow that turns your spectrometer into the trusted identification workhorse it was designed to be.


Why does my FTIR keep giving me low match scores?

Walk into most pharmaceutical QC labs and you will see some version of the same frustration. A technician places a powder loosely on the diamond crystal, presses the plunger halfway down, gets a poor match score and logs it as a suspected material failure. After years of working alongside QC teams across hundreds of laboratories, the Chemetrix team can tell you that this scenario almost always comes down to one of three things.

Poor ATR crystal contact: Infrared light only penetrates a few micrometres into the sample surface. Air gaps or inconsistent pressure mean the evanescent wave never reaches the material properly, producing a weak and noisy spectrum that will not match any reference cleanly.

Generic reference libraries: Most labs rely on commercial libraries built from a single reference sample under ideal conditions. When your actual material arrives with slight batch variation, a different particle size or minor additives, it will not match that idealised reference, even if it is exactly the right material.

Misplaced expectations: A match score measures similarity under the conditions of measurement. It is not an absolute verdict on material identity. Even a correct material from the correct supplier can return a score well below 100% if technique or library quality is off.

The good news is that all three of these problems are fixable.

What is FTIR actually measuring?

FTIR spectroscopy works by focussing on infrared light at a sample and measuring which wavelengths the material absorbs. Every compound has a unique pattern of absorption peaks, its molecular fingerprint. The ATR (attenuated total reflectance) method makes this fast and practical by bouncing the infrared beam off a diamond crystal in contact with the sample, requiring no preparation beyond placing the material on the sensor.

Library matching then compares your sample’s fingerprint to a reference spectrum using a mathematical correlation algorithm. The result is a match score, not a binary yes or no,
but a measure of how similar the two spectra are under the conditions of that measurement. Importantly, standard library search methods are designed to detect differences in the 5 to 10% range between a sample and its reference, which means some variation is expected
and entirely normal.

This is a critical distinction. Natural spectral variation occurs between batches of the same material due to:

  • Moisture content and surface effects
  • Particle size differences between suppliers or manufacturing runs
  • Trace additives or stabilisers that are entirely acceptable within specification

None of these make the material wrong. But all of them will affect your match score if your reference library was not built to account for them.

Here is the insight that changes everything:

FTIR is an identification tool, not a purity tool. It will tell you what something is. It will not tell you how pure it is or quantify trace impurities. That is the job of HPLC. Stop asking your FTIR to do HPLC’s work and start letting it be the world-class ID workhorse it was built to be.

How do you improve ATR sample preparation?

Consistent results require consistent technique.
These are the four rules that make the biggest difference:

Powders: Spread the sample evenly across the full crystal surface before pressing. Apply firm and consistent downward pressure using the sample press. If the signal is weak, press harder and recollect the background.

Hard solids: Press a flat face directly onto the crystal or grind a small portion to a fine powder first. A smooth surface fragment beats a large irregular chunk every time.

Pastes and semi-solids: Apply a thin even layer onto the ATR surface with a spatula. These conform naturally to the crystal and are the easiest sample type to handle well.

Crystal hygiene: Clean the crystal between every sample with an appropriate solvent and a lint-free cloth. A contaminated crystal from the previous sample is an invisible source of error that will affect match scores across multiple runs.

Standardising these steps into a written SOP, what Chemetrix calls the “SOP of the Squeeze”, is the single fastest way to improve reproducibility across your team.

How can you build a pharmaceutical FTIR library that actually works?

The solution to false rejections in pharmaceutical raw material identification is not to lower your acceptance thresholds. It is to build a smarter library. A site-specific library collects reference spectra from your own approved batches of each material, across multiple suppliers and multiple delivery lots, so that the natural variation of your actual materials is built into the reference from the start. When a new batch arrives with slightly different moisture content or particle size, your library recognises it as the correct material because it has seen that variation before.

The instrument that makes this possible: the Agilent Cary 630 FTIR

The Cary 630 is purpose-built for pharmaceutical QC applications. Its instrument configuration delivers energy throughput up to 30% greater than comparable routine FTIR systems, which means faster data collection, lower noise and more reliable spectra even when sample variation is present. Its diamond ATR crystal is impervious to abrasion, requires very small amounts of sample and is easy to clean between samples. Modular sampling accessories click in and out in seconds with no alignment required, and at just 20 x 20 cm on the bench and 3.8 kg, it lives where the work happens rather than in a centralised lab.


Most importantly, the Cary 630 runs Agilent MicroLab software, a method-driven and pictorial interface that makes building site-specific libraries an intuitive task rather than a data science project. MicroLab supports advanced classification methods including PLS-DA (partial least squares discriminant analysis). In published testing using the Cary 630 with MicroLab, a PLS-DA method achieved 100% correct classification of pharmaceutical samples and detected contaminants at levels as low as 0.5%. Results are displayed as colour-coded pass/fail indicators and automatically logged in 21 CFR Part 11 compliant audit trails.

This is what Chemetrix calls the Golden Reference Library: a site-specific and validated collection of spectra that reflects your materials, your suppliers and your real-world conditions. Not a generic database. Yours.


Practical resources:

What does a validated FTIR library mean for regulatory compliance?

For pharmaceutical manufacturers operating in a regulated environment, a site-specific library is not just a practical improvement. It is a compliance asset. The Cary 630 meets or exceeds the performance specifications of the US, European, Japanese, Chinese, Indian and International Pharmacopoeia. Its automated IQ/OQ qualification software generates documented and auditable performance reports covering wavenumber accuracy, spectral resolution and signal-to-noise ratio. MicroLab OQ handles qualification for the US, European and Indian Pharmacopoeia directly, while MicroLab PC can be configured for additional requirements including the Japanese Pharmacopoeia. The optional MicroLab Pharma software package adds full 21 CFR Part 11 and EU Annex 11 support including electronic signatures and data integrity controls.


But instrument qualification is only one part of the compliance picture. A validated reference library, with documented collection conditions, approved batch traceability and defined acceptance criteria, is what gives your QA team the scientific and regulatory confidence to act on FTIR results without
second-guessing every match score.

Chemetrix supports clients through the full validation process, from initial library design through to IQ/OQ documentation and method verification against pharmacopoeial requirements.


Practical resources:

📌 Contact Chemetrix to discuss validation support for your FTIR workflow.

There is a better way to run your QC lab

Too many pharmaceutical QC labs have quietly accepted that FTIR is unreliable. They have added extra retesting steps. They have lowered thresholds without understanding why. They have learned to work around the instrument rather than with it. That is not good science. And it is not a sustainable way to run a quality control operation. Chemetrix believes that every lab, regardless of its size, its budget or its current frustrations, deserves instrumentation that works, workflows that are documented and a team that understands what their results actually mean.

The Cary 630 is not just sold and installed. Chemetrix partners with your team through three practical engagement points:

  • Workflow audit: Identifying exactly why your current match scores are low and where the process is breaking down
  • Method development Assistance: Building and documenting the SOP of the Squeeze that standardises ATR technique across your team
  • Validation support: Ensuring your custom library meets the compliance requirements of your QC environment

When your library is right and your technique is standardised, FTIR stops being a source of anxiety. It becomes what it was always supposed to be: fast, reliable and auditable identification, every time.


Low FTIR match scores are almost never an instrument problem.
They are a library problem or a technique problem, and both are fixable.

The three things to take away from this article:

    • A match score measures similarity under the conditions of measurement. Natural batch variation, particle size differences and trace additives will affect it even when the
      material is correct.
    • ATR sample preparation technique has a bigger impact on match scores than most labs realise. Standardising your approach with a documented SOP is the fastest win available.
    • A site-specific library built from your own approved batches will outperform any generic commercial database for your materials, in your lab and from your suppliers.

The Agilent Cary 630 FTIR makes the instrument side of this straightforward. Chemetrix makes the rest straightforward too.

Ready to stop second-guessing your FTIR results?

📩 Contact the Chemetrix team to book a workflow audit, arrange a Cary 630 demonstration or discuss building your Golden Reference Library: chemetrix.co.za

The Method Validation Wall: Why Elemental Impurity Compliance Stalls and How to Break Through It

There is a particular kind of silence in a pharmaceutical audit that every QA manager knows. It is not the silence of a clean room or an empty corridor. It is the silence after an inspector closes a data file, looks up and says nothing because everything is in order. That silence is the goal. And in elemental impurity testing, it is harder to achieve than most labs expect.

ICH Q3D and USP chapters 232 and 233 set mandatory limits for elemental impurities in pharmaceutical products. Compliance is not discretionary. It is not a best practice recommendation. It is a regulatory requirement that applies to every oral and parenteral drug product on the market. The question is not whether your lab will comply, but whether your workflow can prove it, consistently, at trace levels, across every batch, under inspection.

This article explains where most labs stall, why the problem is almost always a process issue rather than a hardware issue, and how a validated ICP-MS workflow built on the right instrumentation and partnership gives you the audit confidence you need.

What is the real cost of getting elemental impurity testing wrong?

Elemental impurities are unwanted inorganic elements that enter pharmaceutical products through raw materials, metal catalysts used in synthesis, manufacturing equipment or packaging. They include Class 1 elements such as arsenic, cadmium, lead and mercury, which carry the highest toxicological risk, through to Class 2 and Class 3 elements with route-specific exposure limits. None of them belong in a finished drug product above their permissible daily exposure levels, and none of them are detectable by visual inspection, smell or conventional wet chemistry.

This is what makes a compliance failure in this category so damaging. By the time a contamination event is discovered, product has often already been distributed. The financial cost of a recall is significant. The cost to patient trust is permanent. And because elemental impurities at toxic concentrations produce no visible sign of product degradation, the only defence is a validated analytical method that catches them before the product leaves the facility.

The pressure is continuous. Batch testing is not a one-time validation exercise. It is a routine, recurring obligation that runs for the entire commercial life of the product. Every batch. Every route of administration. Every manufacturing site change. The workflow that handles this cannot be fragile, analyst-dependent or difficult to defend under scrutiny.

What do ICH Q3D and USP 232/233 actually require?

ICH Q3D is the international harmonised guideline for elemental impurities in pharmaceutical products. It is adopted by the US Food and Drug Administration, the European Medicines Agency, Japan’s Pharmaceuticals and Medical Devices Agency and other global regulatory bodies. It establishes permissible daily exposure limits for a defined set of elemental impurities across oral and parenteral administration routes.

USP chapter 232 sets the acceptance criteria, defining the specific concentration limits for each element by route of administration. USP chapter 233 defines the analytical procedures required to demonstrate compliance, including the method validation parameters of specificity, linearity, accuracy, precision and detection limits.

The analytical techniques specified under USP 233 for elemental impurity analysis are ICP-MS and ICP-OES. These are the techniques that provide the ideal capabilities for determining inorganic contaminants to ICH Q3D and USP 233 requirements. Between the two, ICP-MS is the instrument of choice for most pharmaceutical laboratories, offering superior sensitivity at trace and ultra-trace concentration levels across the full range of regulated elements. ICP-OES is well suited to elements present at higher concentrations and to laboratories where the breadth of the ICP-MS dynamic range is not required for every element in scope.

Together, ICH Q3D, USP 232 and USP 233 define not just what must be measured, but how the measurement must be proven to work and on which platform. The regulatory framework is specific. The instrumentation it points to is equally specific.

Where does the ICP-MS workflow actually break down?

The Chemetrix team consistently identifies method validation as the point where pharmaceutical labs stall. Not instrument performance.
Not detection capability. Method validation.

The leap from early-stage R&D profiling, where the goal is elemental detection and characterisation, to validated routine QC, where the goal is defensible batch release data, is significant. In R&D, an analyst runs a method, gets a result and moves on. In QC, that same method must be formally validated, transferred to a different instrument or operator, proven robust across variations in sample matrix and demonstrated to remain fit for purpose over time.

This is where the human and process variables multiply. Instrument-to-instrument method transfer introduces drift. Analyst-to-analyst variability in sample preparation introduces inconsistency. Calibration standard preparation from single-element solutions introduces calculation errors and traceability gaps. Any one of these variables can generate an audit finding, not because the underlying science was wrong, but because the documentation did not adequately capture what was done and why.

The calibration standard problem deserves particular attention. Preparing ICP-MS calibration solutions for a multi-element elemental impurity method from individual single-element stock solutions is time-consuming, error-prone and difficult to trace. A single pipetting error, an incorrect dilution factor or a matrix mismatch between the standard and the sample can compromise the entire run. In a routine QC environment running batch after batch, these risks compound over time.

Chemetrix Insight: “In ICP-MS-based elemental impurity testing, the strongest flagship is not the data. It is the defensibility of that data.”

How do you build a validated ICP-MS elemental impurity workflow that holds up under inspection?

The answer is to remove as many human variables as possible before the method reaches routine QC. For ICP-MS elemental impurity workflows, this starts with the reference materials.

Use pre-formulated, certified reference material kits designed specifically for USP 232/233

Agilent’s ICH Q3D/USP 233 Elemental Impurities Portfolio does exactly this. The portfolio includes certified reference material kits for both oral and parenteral routes, with elements sorted by ICH and USP class, chemical compatibility and relative mandated concentrations.

This design eliminates the need for analysts to prepare their own calibration standards from single-element solutions, removing the most significant source of human error in the ICP-MS calibration workflow. Instead of calculating and preparing multi-element mixes from scratch, analysts work from pre-formulated, ready-to-use solutions that are already matched to the permissible daily exposure levels required by the method.

The kits are manufactured in an ISO 17034-accredited facility and certified in an ISO/IEC 17025 testing laboratory. Each kit is supplied with a Certificate of Analysis confirming actual concentrations, measurement uncertainty and NIST traceability. A dedicated Pharma Internal Standard Solution is included, optimised specifically for ICP-MS and ICP-OES results with common pharmaceutical sample types, which is critical for accurate internal standardisation across the wide mass range covered by a full USP 232/233 elemental panel.

Agilent has also updated these kits to reflect the most recent USP 232 guideline changes, which increased the permissible limits for gold and silver. Using current, regulatory-aligned certified reference materials is a fundamental audit requirement and one that is easily overlooked when laboratories are managing their own standard preparation programmes.

Build on preset ICP-MS methods designed for USP 232/233 compliance

Agilent ICP-MS and ICP-OES platforms include preset methods built specifically for ICH Q3D and USP 232/233 compliance. This reduces the configuration burden during method transfer from R&D to QC and provides a validated starting point that is consistent across instruments, reducing the risk of method drift between sites
or between analysts.


What makes the ICP-MS the right platform
for pharmaceutical elemental impurity compliance?

The ICP-MS is the primary instrument for pharmaceutical elemental impurity testing because the regulatory requirements demand it. USP 233 specifies trace-level multi-element analysis across a wide range of elemental classes with strict accuracy and precision requirements.
ICP-MS is uniquely suited to this task, offering the sensitivity, selectivity and multi-element capability that the method demands.

For pharmaceutical applications specifically, the combination of the Agilent ICP-MS platform with the ICH Q3D/USP 233 certified reference material kits creates a complete, traceable, regulation-aligned solution. The oral kit covers the full panel of elements required for oral drug product release. The parenteral kit addresses the tighter permissible daily exposure limits applicable to injectable and infusion products, where the regulatory scrutiny is highest.

The Agilent ICP-OES platform extends this capability to elements present at higher concentration ranges, and provides a complementary option for laboratories where the full sensitivity range of ICP-MS is not required for every element in scope. For many pharmaceutical laboratories, ICP-MS and ICP-OES are used together to cover the complete elemental panel efficiently.

Agilent’s OpenLAB Software Suite supports data management and analysis across the ICP-MS and ICP-OES platforms, maintaining the data integrity and audit trail controls required in a regulated pharmaceutical environment. Analytical Instrument Qualification and Functional Verification services are available from Agilent to support regulatory submissions and inspection readiness, ensuring that the instrument performing the analysis is as well-documented as the method itself.

📌 Ask Chemetrix about configuring a complete ICP-MS elemental impurity compliance workflow, including reference materials, method setup and instrument qualification.

Audit-ready is not a feature, it is a service

Supplying an Agilent ICP-MS system is the beginning of the story, not the end. The instrument is capable. Whether the workflow built around it is defensible under inspection is a different question entirely, and it is the question that Chemetrix answers.

Too many labs reach the method validation wall and stall there. They have the instrument. They have the regulatory guidance. But the gap between a working ICP-MS method and a validated, documented, transferable method that survives an audit is wider than most labs anticipate when they start the project.

Chemetrix closes that gap through three specific services:

  • Method Development and Transfer: Chemetrix does the heavy lifting of trace-level ICP-MS method development, building validated elemental impurity procedures that are designed from the start to transfer cleanly from R&D to routine QC without drift. This includes worst-case element selection, matrix-matched calibration design and the full validation parameter set required by USP 233.
  • Routine Batch Reliability: Long-term instrument stability for recurring batch testing does not happen automatically. Chemetrix provides the service framework that keeps ICP-MS instruments qualified, certified reference materials current and data trails complete, so that the programme running today is still audit-ready in three years.
  • Audit-Ready Documentation: From instrument qualification records through to method validation reports and standard operating procedures, Chemetrix helps build the documentation package that turns a technically sound ICP-MS workflow into a regulatorily defensible one.

Compliance is mandatory. The data alone is not enough.
It is the documented, traceable, reproducible system behind the data that gives regulators confidence and gives patients the protection they are owed.

Conclusion

Elemental impurity compliance under ICH Q3D and USP 232/233 is one of the most technically demanding and most consequential analytical obligations in pharmaceutical manufacturing. The stakes are patient safety. The standard is mandatory. And the challenge is not the sensitivity of the ICP-MS. It is the defensibility of the workflow built around it.

The three things to take away from this article:

  • ICP-MS is the primary analytical platform specified for USP 232/233 compliance. Building your elemental impurity workflow around a purpose-designed, regulation-aligned ICP-MS configuration is the most direct path to audit readiness.
  • Pre-formulated certified reference material kits remove the single biggest human variable in the ICP-MS calibration workflow. Agilent’s ICH Q3D/USP 233 portfolio is manufactured to ISO 17034 and certified to ISO/IEC 17025, with NIST-traceable Certificates of Analysis for every kit.
  • The silence of a successful audit is earned, not assumed. It comes from a validated ICP-MS system, traceable reference materials, consistent sample preparation and documentation that tells a complete and accurate story.

The Agilent ICP-MS platform and certified reference material portfolio provide the instrumentation and standards. Chemetrix provides the validated workflow, the ongoing support and the audit-ready confidence that makes elemental impurity compliance continuous rather than periodic.

Ready to move from compliance pressure to compliance confidence?

📩 Contact the Chemetrix team to discuss ICP-MS configuration, reference material selection or audit preparation for your elemental impurity programme: chemetrix.co.za